Showing posts with label DayTrading. Show all posts

Monday, October 12, 2026

FOOTPRINT Ultimate v2.19 The Trading System For MT4 and MT5 Information

A candle gives you four prices. Open, high, low, close. What it doesn’t show you is what happened in between. How much buying hit each price. How much selling. Where most of the volume actually traded. Two candles can look exactly the same and have completely different stuff going on inside. One had buyers pushing the whole way up. The other had sellers quietly unloading into every tick higher.

A footprint chart opens the candle up so you can see that. It splits each bar into price levels and prints the buy volume and the sell volume at every level. Most footprint tools live on futures platforms. If you trade on MetaTrader, your options have been pretty thin. FOOTPRINT is a new indicator that puts this on your MT4 or MT5 chart. Bid and ask volume, delta, point of control, imbalances.

All on the chart you already use.If you’ve ever seen a chart with tiny numbers printed inside the candles and thought “nope”, this one’s for you. That’s called a footprint chart. Here’s the simple version. Every buy and every sell happens at a price. A footprint counts those orders at each price inside a candle and splits them into two columns.

Left number: selling (orders that hit the bid),,Right number: buying (orders that lifted the ask). That’s most of it. A few other words you’ll see:

Delta: buying minus selling for the whole candle. Positive means buyers were more aggressive. Negative means sellers were.

Cumulative delta: delta added up over the session, so you can see who’s been in control over time.

POC (point of control): the price where the most volume traded. Traders keep a close eye on these levels.

Imbalance: a price where one side heavily outnumbered the other.

FOOTPRINT is an indicator that draws all of this on MT4 and MT5. You attach it to a chart like any other indicator. Quick heads up on forex: MetaTrader gives you tick data, not exchange volume, so FOOTPRINT builds its read from your broker’s live ticks. That’s how order flow tools work on forex in general.

It won’t make you a better trader by itself. You still have to learn to read it. But if you’ve been curious what volume is doing under the candles, this is a pretty clear way to see it.

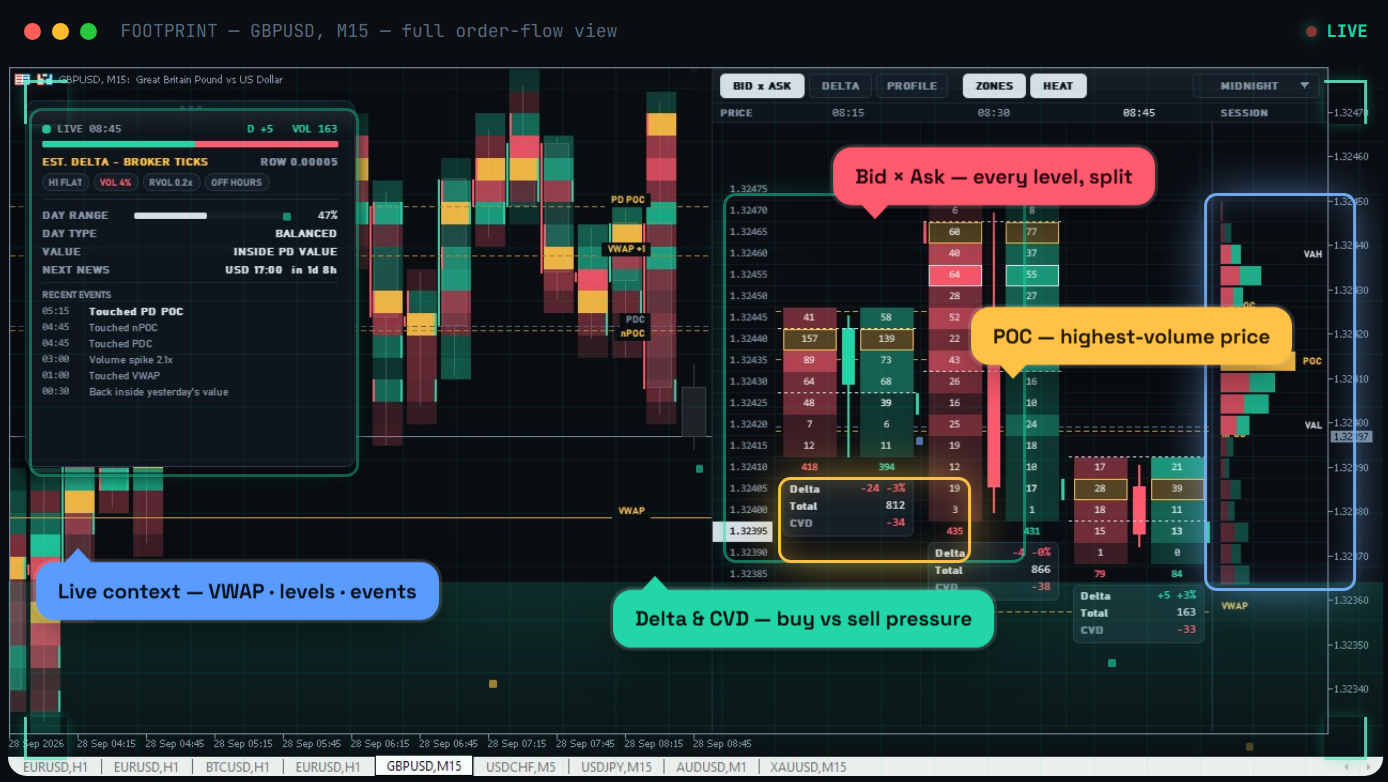
This is a live simulation of FOOTPRINT running on a MetaTrader chart — candles on the left, the bid × ask footprint dock on the right, delta and CVD updating in real time. Watch it move. Each cell shows two numbers: volume traded at the bid (aggressive selling) on the left, and volume at the ask (aggressive buying) on the right. In one glance you see whether buyers or sellers were the ones pushing at every single price inside the candle.

Delta is ask volume minus bid volume: positive means buyers were more aggressive, negative means sellers were. Cumulative delta (CVD) adds it up across the session so you can spot accumulation and distribution a single bar can’t reveal — and catch divergence when price and delta disagree. An imbalance flags where buying or selling at a level was dramatically one-sided (a configurable ratio, 300% by convention).

When three or more stack in a row — a stacked imbalance — that’s concentrated aggression, and those zones often act as support or resistance on the retest. Absorption is heavy aggression that fails to move price — passive orders are soaking it up, and a reversal often follows. Exhaustion is when aggressive participation dries up near an extreme. FOOTPRINT highlights both as they form, not three candles later.

The point of control (POC) is the price with the most traded volume. The value area is the range holding ~70% of volume — the market’s “fair value” zone. FOOTPRINT draws POC, value area and a live session volume profile so you always know the high-volume nodes and the gaps.

  • Buy and sell volume at every price level inside every candle.
  • Real-time buy/sell pressure and cumulative delta with session or bar reset.
  • Point of control and the 70% value zone, per bar and per session.
  • Adjustable-ratio imbalances and stacked-imbalance zones, flagged automatically.
  • See heavy aggression that fails to move price, and moves running out of fuel.
  • Volume-weighted average price and a live session volume profile.
  • Get pinged on stacked imbalances, absorption and delta extremes.
  • Sits alongside your S/R, moving averages and supply/demand zones.
  • One license covers both platforms. MT4 runs with your broker’s MT5 alongside, no new broker.

Time entries to the tick. See absorption and exhaustion before the turn, not after. Confirm breakouts with real delta and stacked imbalances. Skip the fakeouts. See the order flow behind your order blocks, FVGs and liquidity sweeps. Tighter entries and cleaner invalidation = better risk and bigger payouts.

Source: Volume Footprint

.

ForexTradingSystem ,Forex ,TradingStrategy ,ForexTips ,ForexMarket ,CurrencyTrading ,DayTrading ,Investing ,FinancialFreedom ,TechnicalAnalysis ,ForexSignals ,PriceAction ,Pips ,ForexLife ,CurrencyExchange ,TradingEducation ,WealthBuilding ,MarketAnalysis ,ExtremeTrading ,ForexCommunity

Sunday, July 12, 2026

What Is Forex & Should It Be Part Of Your Investment Strategy 

getty

Individual investors are increasingly trying their hand at foreign exchange trading, also known as forex or FX. No longer reserved for global corporations and institutional traders, forex trading can diversify your portfolio, hedge against future weakening of the dollar, and produce short- or long-term profits. Read on to find out if forex should be part of your investment strategy. We’ll cover forex basics, including how currency trades work, what the risks are, and how you can get started…….Continue reading…..

By Catherine Brock

Source: Forbes

.

Critics:

The foreign exchange market is the most liquid financial market in the world. Traders include governments and central banks, commercial banks, other institutional investors and financial institutions, currency speculators, other commercial corporations, and individuals. According to the 2025 Triennial Central Bank Survey, coordinated by the Bank for International Settlements, average daily turnover was $9.6 trillion in April 2025 (compared to $4 trillion in 2010).

Of this $9.6 trillion, $3 trillion was spot transactions and $6.6 trillion was traded in outright forwards, swaps, and other derivatives. Foreign exchange is traded in an over-the-counter market where brokers/dealers negotiate directly with one another, so there is no central exchange or clearing house. The biggest geographic trading center is the United Kingdom, primarily London.

In April 2025, trading in the United Kingdom accounted for 37.8% of the total, making it by far the most important center for foreign exchange trading in the world. Owing to London’s dominance in the market, a particular currency’s quoted price is usually the London market price. For instance, when the International Monetary Fund calculates the value of its special drawing rights every day, they use the London market prices at noon that day.

Trading in the United States accounted for 18.6%, Singapore and Hong Kong account for 11.8% and 7.0%, respectively, and Japan accounted for 3.5%. Turnover of exchange-traded foreign exchange futures and options was growing rapidly in 2004–2013, reaching $145 billion in April 2013 (double the turnover recorded in April 2007). As of April 2025, exchange-traded currency derivatives represent 2% of OTC foreign exchange turnover.

Foreign exchange futures contracts were introduced in 1972 at the Chicago Mercantile Exchange and are traded more than to most other futures contracts. Most developed countries permit the trading of derivative products (such as futures and options on futures) on their exchanges. All these developed countries already have fully convertible capital accounts. Some governments of emerging markets do not allow foreign exchange derivative products on their exchanges because they have capital controls.

The use of derivatives is growing in many emerging economies. Countries such as South Korea, South Africa, and India have established currency futures exchanges, despite having some capital controls. Foreign exchange trading increased by 20% between April 2007 and April 2010 and has more than doubled since 2004.

The increase in turnover is due to a number of factors: the growing importance of foreign exchange as an asset class, the increased trading activity of high-frequency traders, and the emergence of retail investors as an important market segment. The growth of electronic execution and the diverse selection of execution venues has lowered transaction costs, increased market liquidity, and attracted greater participation from many customer types.

In particular, electronic trading via online portals has made it easier for retail traders to trade in the foreign exchange market. By 2010, retail trading was estimated to account for up to 10% of spot turnover, or $150 billion per day (see below: Retail foreign exchange traders).An important part of the foreign exchange market comes from the financial activities of companies seeking foreign exchange to pay for goods or services.

Commercial companies often trade fairly small amounts compared to those of banks or speculators, and their trades often have a little short-term impact on market rates. Nevertheless, trade flows are an important factor in the long-term direction of a currency’s exchange rate. Some multinational corporations (MNCs) can have an unpredictable impact when very large positions are covered due to exposures that are not widely known by other market participants.

In a fixed exchange rate regime, exchange rates are decided by the government, while a number of theories have been proposed to explain (and predict) the fluctuations in exchange rates in a floating exchange rate regime, including:

  • International parity conditions: Relative purchasing power parity, interest rate parity, Domestic Fisher effect, International Fisher effect. To some extent the above theories provide logical explanation for the fluctuations in exchange rates, yet these theories falter as they are based on challengeable assumptions (e.g., free flow of goods, services, and capital) which seldom hold true in the real world.
  • Balance of payments model: This model, however, focuses largely on tradable goods and services, ignoring the increasing role of global capital flows. It failed to provide any explanation for the continuous appreciation of the US dollar during the 1980s and most of the 1990s, despite the soaring US current account deficit.
  • Asset market model: views currencies as an important asset class for constructing investment portfolios. Asset prices are influenced mostly by people’s willingness to hold the existing quantities of assets, which in turn depends on their expectations on the future worth of these assets. The asset market model of exchange rate determination states that “the exchange rate between two currencies represents the price that just balances the relative supplies of, and demand for, assets denominated in those currencies.”

None of the models developed so far succeed to explain exchange rates and volatility in the longer time frames. For shorter time frames (less than a few days), algorithms can be devised to predict prices. It is understood from the above models that many macroeconomic factors affect the exchange rates and in the end currency prices are a result of dual forces of supply and demand.

The world’s currency markets can be viewed as a huge melting pot: in a large and ever-changing mix of current events, supply and demand factors are constantly shifting, and the price of one currency in relation to another shifts accordingly. No other market encompasses (and distills) as much of what is going on in the world at any given time as foreign exchange.

India’s Forex Kitty Jumps $7.26 Bn to $674.19 Bn 

.
ForexInvestment ,ForexTrading ,Investing ,ForexMarket ,CurrencyTrading ,ForexTips ,InvestmentStrategy ,ForexTrends ,FinancialFreedom ,DayTrading ,WallStreet ,TradingTips ,MarketAnalysis ,WealthBuilding ,GlobalMarkets ,ForexSignals ,MoneyManagement ,TradingEducation ,InvestSmart ,ForexLife ,Forex
Fediverse Reactions
  • #financialfreedom
  • #currencytrading
  • #daytrading
  • #forex
  • #forexinvestment
  • #globalmarkets
  • #investmentstrategy
  • #investsmart
  • #investing
  • #forexlife
  • #forexsignals
  • #marketanalysis
  • #forextips
  • #forextrends
  • #moneymanagement
  • #tradingtips
  • #wallstreet
  • #wealthbuilding
  • #tradingeducation

Leave a Reply

Nvidia Stock Scandal: 4 Experts on NVDA’s Future

NVIDIA Corporation ( NVDA ) is facing a new test after co-founder Jensen Huang resigned as chief executive amid a personal-conduct scandal ...