A candle gives you four prices. Open, high, low, close. What it doesn’t show you is what happened in between. How much buying hit each price. How much selling. Where most of the volume actually traded. Two candles can look exactly the same and have completely different stuff going on inside. One had buyers pushing the whole way up. The other had sellers quietly unloading into every tick higher.
A footprint chart opens the candle up so you can see that. It splits each bar into price levels and prints the buy volume and the sell volume at every level. Most footprint tools live on futures platforms. If you trade on MetaTrader, your options have been pretty thin. FOOTPRINT is a new indicator that puts this on your MT4 or MT5 chart. Bid and ask volume, delta, point of control, imbalances.
All on the chart you already use.If you’ve ever seen a chart with tiny numbers printed inside the candles and thought “nope”, this one’s for you. That’s called a footprint chart. Here’s the simple version. Every buy and every sell happens at a price. A footprint counts those orders at each price inside a candle and splits them into two columns.
Left number: selling (orders that hit the bid),,Right number: buying (orders that lifted the ask). That’s most of it. A few other words you’ll see:
Delta: buying minus selling for the whole candle. Positive means buyers were more aggressive. Negative means sellers were.
Cumulative delta: delta added up over the session, so you can see who’s been in control over time.
POC (point of control): the price where the most volume traded. Traders keep a close eye on these levels.
Imbalance: a price where one side heavily outnumbered the other.
FOOTPRINT is an indicator that draws all of this on MT4 and MT5. You attach it to a chart like any other indicator. Quick heads up on forex: MetaTrader gives you tick data, not exchange volume, so FOOTPRINT builds its read from your broker’s live ticks. That’s how order flow tools work on forex in general.
It won’t make you a better trader by itself. You still have to learn to read it. But if you’ve been curious what volume is doing under the candles, this is a pretty clear way to see it.
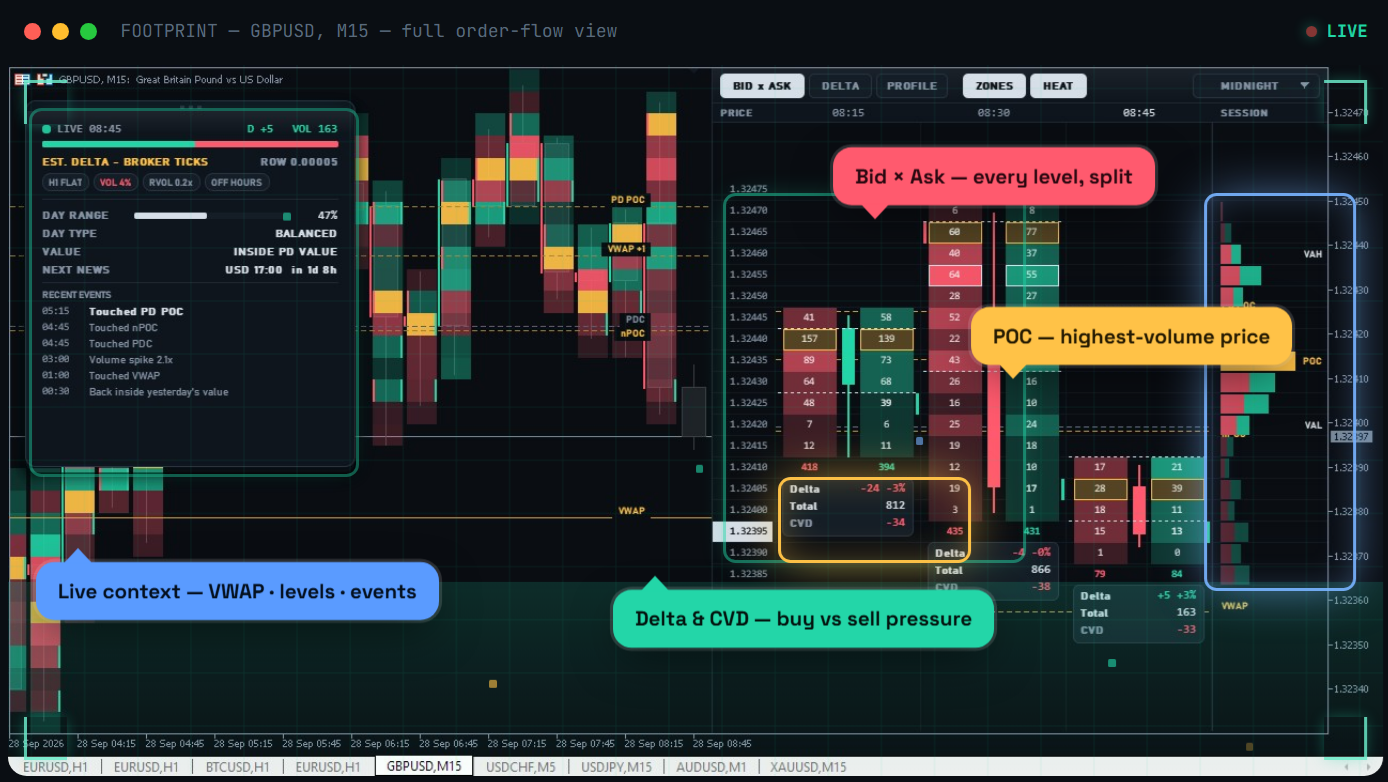
This is a live simulation of FOOTPRINT running on a MetaTrader chart — candles on the left, the bid × ask footprint dock on the right, delta and CVD updating in real time. Watch it move. Each cell shows two numbers: volume traded at the bid (aggressive selling) on the left, and volume at the ask (aggressive buying) on the right. In one glance you see whether buyers or sellers were the ones pushing at every single price inside the candle.
Delta is ask volume minus bid volume: positive means buyers were more aggressive, negative means sellers were. Cumulative delta (CVD) adds it up across the session so you can spot accumulation and distribution a single bar can’t reveal — and catch divergence when price and delta disagree. An imbalance flags where buying or selling at a level was dramatically one-sided (a configurable ratio, 300% by convention).
When three or more stack in a row — a stacked imbalance — that’s concentrated aggression, and those zones often act as support or resistance on the retest. Absorption is heavy aggression that fails to move price — passive orders are soaking it up, and a reversal often follows. Exhaustion is when aggressive participation dries up near an extreme. FOOTPRINT highlights both as they form, not three candles later.
The point of control (POC) is the price with the most traded volume. The value area is the range holding ~70% of volume — the market’s “fair value” zone. FOOTPRINT draws POC, value area and a live session volume profile so you always know the high-volume nodes and the gaps.
- Buy and sell volume at every price level inside every candle.
- Real-time buy/sell pressure and cumulative delta with session or bar reset.
- Point of control and the 70% value zone, per bar and per session.
- Adjustable-ratio imbalances and stacked-imbalance zones, flagged automatically.
- See heavy aggression that fails to move price, and moves running out of fuel.
- Volume-weighted average price and a live session volume profile.
- Get pinged on stacked imbalances, absorption and delta extremes.
- Sits alongside your S/R, moving averages and supply/demand zones.
- One license covers both platforms. MT4 runs with your broker’s MT5 alongside, no new broker.
Time entries to the tick. See absorption and exhaustion before the turn, not after. Confirm breakouts with real delta and stacked imbalances. Skip the fakeouts. See the order flow behind your order blocks, FVGs and liquidity sweeps. Tighter entries and cleaner invalidation = better risk and bigger payouts.
Source: Volume Footprint
.
ForexTradingSystem ,Forex ,TradingStrategy ,ForexTips ,ForexMarket ,CurrencyTrading ,DayTrading ,Investing ,FinancialFreedom ,TechnicalAnalysis ,ForexSignals ,PriceAction ,Pips ,ForexLife ,CurrencyExchange ,TradingEducation ,WealthBuilding ,MarketAnalysis ,ExtremeTrading ,ForexCommunity


Leave a Reply